


Tracking performance without a consistent system often leads to mixed signals. When teams use different reporting methods or change metrics from one cycle to the next, it becomes nearly impossible to connect results, spot patterns, or make confident decisions. A KPI template brings structure by standardizing how goals are defined, measured, and reported, so everyone works from a single source of truth.
With consistent metrics in place, teams see progress at a glance, catch problems early, and focus effort on what drives real impact. The difference between data that sits in a spreadsheet and data that changes decisions usually comes down to structure, and a well-built KPI template is where that structure starts. When that template lives in monday AI Workspace, it becomes more than a static framework: automated data collection keeps numbers current, AI-powered insights surface trends and anomalies as they happen, and real-time dashboards turn performance tracking into a continuous feedback loop that informs decisions when they matter most.
Key takeaways
- Focus on what matters: track five to seven KPIs that align directly with strategic goals; more than that can dilute clarity and impact
- Choose actionable metrics: select measures you can influence and verify, and avoid vanity metrics that look impressive but don’t drive decisions
- Automate reporting: monday AI Workspace turns manual KPI tracking into real-time insights, freeing teams to focus on performance improvement
- Involve your team: when employees help define their KPIs, engagement increases, and accountability becomes shared
- Review regularly: update templates each quarter to keep metrics aligned with current business goals and relevant to decision-making
What is a KPI template?
A KPI template is a pre-built framework for tracking key performance indicators, giving you a ready-made structure for measuring what matters most. Every KPI is a metric, but not every metric is a KPI: a KPI is the small set of measures tied directly to a strategic goal, while a metric can be anything you happen to count. This focus matters: McKinsey research on performance management found that companies that focus on their people’s performance are 4.2 times more likely to outperform their peers, with about 30% higher average revenue growth. That finding applies broadly to performance management, and consistent tracking tools like KPI templates are a practical part of it.
This template should be considered a blueprint that captures your most important metrics in one place: it helps to define what to measure, how often to check it, and who’s responsible for each metric.
The power lies in consistency. When everyone uses the same template, you can compare performance across teams, projects, and time periods. No more guessing whether this month’s project report matches last quarter’s format.
What goes into a KPI template?
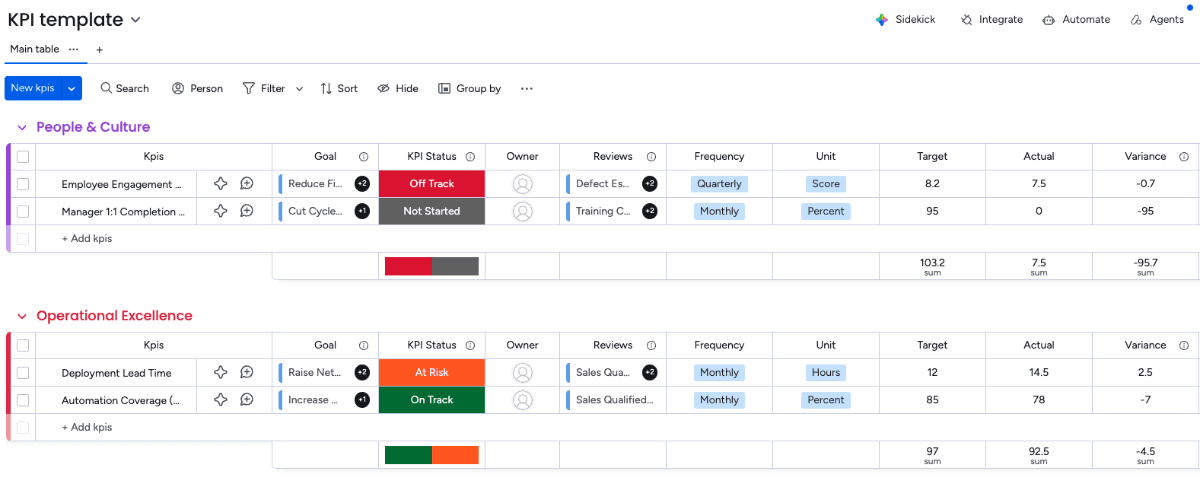
A useful KPI template does more than list numbers. It captures the context around each metric, so anyone reading it knows what the number means, who owns it, and whether it’s on track. If you can build one from scratch, you can adapt it to any team.
The fields below are the standard building blocks every KPI template should include.
| Element | What it captures |
|---|---|
| KPI name | The specific measure being tracked, stated in plain language |
| Linked business objective | The strategic goal the KPI supports, so the metric never floats on its own |
| Definition or formula | Exactly how the number is calculated, so results stay consistent over time |
| Baseline | The starting value, giving you a reference point for progress |
| Target | The value you’re aiming for, with a deadline attached |
| Owner | The person accountable for the metric and the actions behind it |
| Data source | Where the number comes from, so updates are reliable and repeatable |
| Update frequency | How often the KPI is refreshed, from daily to quarterly |
| Status | A simple on track, at risk, or off track signal for quick scanning |
Standardizing these fields makes results comparable across teams and clears up a common source of confusion: only 47% of employees strongly agree they know what is expected of them at work, according to Gallup’s Q2 2025 data. A shared template makes those expectations explicit. When every department defines a KPI the same way, leadership can roll up performance without first translating six different formats. On a connected work management platform, board columns can automatically capture the owner, target, and status, so the template updates as work moves forward rather than waiting for a manual refresh.
KPI templates vs regular performance reports
KPI templates create consistency and structure that one-off reports often lack. While regular reports capture whatever seems important at the moment, templates define exactly what to measure, how to track it, and who is responsible, ensuring data stays meaningful and comparable over time.
Here’s what makes templates different from ad hoc reports:
- Standardized format: consistent layouts make trends and performance patterns easy to identify
- Reusable framework: once created, templates can be applied across teams or projects without starting from scratch
- Strategic focus: emphasizes metrics tied directly to business goals
- Cross-team alignment: ensures every department measures success in the same way
Instead of manually gathering numbers from multiple systems, teams can use structured templates to track KPIs automatically. Work management platforms make this simple by supporting customizable KPI boards or a DMAIC template that auto-populates metrics, owners, and timelines, turning hours of setup into minutes.
Essential types of KPI templates
Different situations call for different template formats. Typically, there are three main types to choose from based on who needs the information and how they’ll use it:
Dashboard templates
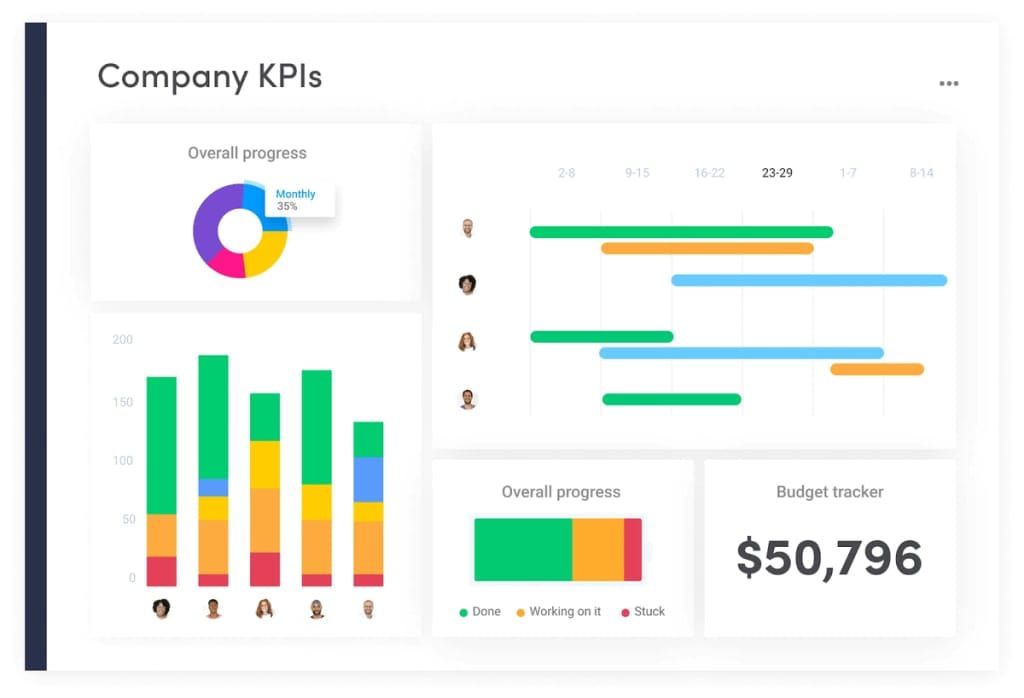
Dashboard templates show multiple KPIs at once through visual displays. Picture a control panel with gauges, charts, and status lights that update in real time.
These work best when you need quick status checks. A glance tells you what’s on track (green), what needs attention (yellow), and what’s critical (red).
Scorecard templates
Scorecard templates compare actual results against targets. They answer one question: are we hitting our goals?
Executive teams love these for board meetings. One page shows performance across all key areas, with no digging through data required.
Executive report templates
Executive report templates combine numbers with narrative. They don’t just show what happened; they explain why it matters and what to do next.
Use these for quarterly reviews or strategic planning sessions. The template guides you through data, analysis, and recommendations in a logical flow.
How to select KPIs that drive business impact
Choosing the right KPIs starts with a simple question: what decisions will this metric help us make? If the answer isn’t clear, you’re probably tracking the wrong thing.
Many teams fall into the trap of measuring everything they can. They sometimes end up drowning in data that looks impressive but doesn’t drive action, which is why an action plan template can help refocus on meaningful KPIs.
A good KPI is specific, measurable, achievable, relevant, and time-bound, which is the SMART framework applied to measurement. It also pays to balance leading indicators that predict future performance with lagging indicators that confirm past results, so you catch problems early and still validate outcomes.
It’s essential to focus on metrics that meet these criteria:
- Business alignment: directly supports your strategic goals
- Actionability: your team can actually influence this number
- Measurability: you can track it accurately with current systems
- Stakeholder relevance: decision-makers care about this metric
Keep your list short. Five to seven KPIs per template maintains focus without overwhelming anyone. If you need further help, turn to work management platforms that let you build focused KPI dashboards that highlight only your most critical metrics.
Five steps to build your KPI template
Building an effective template doesn’t require complex frameworks. Follow these handy steps to create something your team will actually use:
Step 1: map business objectives
Start with your end goals. What are you trying to achieve this quarter or year?
Write down your top business objectives. Then connect each one to specific, measurable outcomes. If you can’t measure it, you can’t manage it.
Step 2: define key performance areas
Break big goals into measurable chunks. A goal like “improve customer satisfaction” needs specific areas to track.
You’ll want both leading and lagging indicators too:
- Leading indicators: predict future performance (like response time).
- Lagging indicators: confirm past results (like satisfaction scores).
Step 3: choose measurable indicators
Pick specific metrics for each area. Make sure you can actually get this data reliably.
Test your data sources first. Nothing kills KPI adoption faster than metrics that require manual calculations or data that’s always out of date.
Step 4: set performance targets
Set targets that stretch your team without breaking them. Use historical data when possible.
Involve the people who’ll be measured, as they know what’s realistic and will buy into targets they helped create.
Step 5: create your tracking framework
Finally, design how you’ll collect, review, and act on the data. This includes:
- Data sources: where do the numbers come from?
- Update frequency: how often should you refresh?
- Review cycles: this is when teams discuss results
- Ownership: who maintains each metric?
With an intuitive work management platform, you can streamline this entire process with automated data collection and scheduled performance reporting, so your framework essentially runs itself.
KPI template examples by department
Every department needs different metrics. Below is a guide to sample templates and how effective templates might look across your organization.
Sales performance templates
Sales teams live and die by their pipeline. Their KPI templates focus on revenue generation and sales efficiency:
- Conversion rate: percentage of leads that become customers
- Average deal size: revenue per closed deal
- Sales cycle length: days from first contact to close
- Pipeline velocity: speed of movement through sales stages
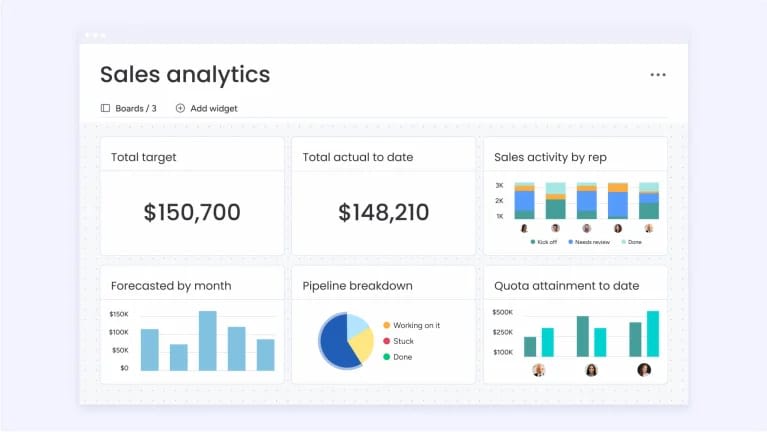
These metrics reveal whether your sales engine runs smoothly or needs a tune-up. See those exact KPIs visualized with sales dashboard templates for conversion rate, deal size, cycle length, and pipeline velocity.
Marketing performance templates
KPI marketing templates balance spend against results. Key metrics include:
- Customer acquisition cost: total spend per new customer
- Marketing qualified leads: leads ready for sales handoff
- Conversion by channel: which campaigns drive results
- Return on marketing investment: revenue generated per dollar spent
By using a connected work management platform, you can link these metrics directly to campaign data, showing real ROI without manual calculations.
Operations excellence templates
Operations management templates monitor efficiency and quality, with key features including:
- Process cycle time: how long key workflows take
- Quality scores: error rates and defect tracking
- Resource utilization: how effectively you use available capacity
- Service response times: speed of issue resolution
These metrics help you spot bottlenecks before they impact customers.
HR performance templates
HR templates track talent and culture health. They often include:
- Employee engagement scores: pulse survey results
- Retention rates: who’s staying vs. leaving
- Time-to-hire: days to fill open positions
- Training completion: skills development progress
Strong HR metrics can help predict future performance issues before they hurt the business.
Financial performance templates
Financial templates provide business health indicators:
- Cash flow metrics: money in vs. money out
- Profit margins by product: what drives profitability?
- Budget variance: actual vs planned spending
- Working capital efficiency: how well you manage resources
These fundamentals keep leadership informed and confident in financial decisions.

IT and service performance templates
IT and service teams measure reliability and response, since downtime and slow resolution hit every other department. Their templates focus on how quickly issues get resolved and how consistently systems stay available:
- Mean time to resolution: average time to close a ticket or incident
- Ticket backlog: the number of open requests waiting for action
- SLA compliance: percentage of tickets resolved within agreed service levels
- System uptime: the share of time critical systems stay available
These metrics tell service leaders where support is strong and where staffing or automation needs attention before users feel the pain.
Seven best practices for successful KPI tracking
Even experienced teams stumble with KPIs for project management. Here are the pitfalls that derail most initiatives, and how to sidestep them.
Tracking too many KPIs
When everything’s important, nothing is. Teams with 20+ KPIs spend more time collecting data than acting on it. Most practitioners recommend limiting each template to five to seven KPIs to manage and track progress against goals, so you focus on what truly matters.
Choosing vanity metrics
Big numbers feel good but might mean nothing. A million website visits sounds impressive, until you realize none convert to customers. Pick metrics tied to business outcomes.
Setting unrealistic targets
Unrealistic goals can diminish motivation, so stretch goals should challenge, not discourage. If your team is consistently falling short, a structured performance improvement plan can help them get back on track.
Ignoring data quality
Reliable data leads to sound decisions. If your numbers don’t add up or come from unreliable sources, fix the foundation before building reports.
Never updating metrics
Business changes, but many teams keep tracking outdated KPIs. Schedule quarterly reviews to ensure metrics still align with current priorities.
Missing stakeholder buy-in
KPIs imposed from above rarely stick. Include team members in selecting metrics they’ll be measured against. Ownership drives adoption.
Measuring without action
The goal is to create actionable dashboards that teams use consistently. Every KPI should trigger specific actions when it moves up or down.
Sophisticated work management platforms help teams avoid these mistakes with automated tracking, built-in data validation, and action triggers based on KPI thresholds.
Automating KPI reports for real-time insights
Manual KPI tracking often slows teams down and increases the risk of errors. Automation solves that by delivering accurate, up-to-date insights without the repetitive manual work.
The clearest shift in 2026 is the move from static spreadsheets and monthly reports to continuous, AI-assisted monitoring. If you want to stop manually updating KPIs, connect your data sources once and let the system refresh numbers and flag anomalies on its own. With real-time tracking, performance issues surface as they happen, not weeks later during review meetings. When a key metric falls below its threshold, teams can respond immediately to keep goals on track.
Automation delivers:
- Timeliness: access to current data for faster decisions
- Accuracy: fewer errors from manual entry or calculation mistakes
- Consistency: reports arrive in the same format and on the same schedule every time
- Scalability: track more metrics without increasing workload
Work management platforms make automation simple by pulling data from connected systems, generating reports on schedule, and sending smart alerts when KPIs need attention. This keeps teams focused on insights and action, not administration.

Bringing KPI tracking into monday AI Workspace
Most KPI templates start life in a spreadsheet, then slowly fall behind the work they’re meant to measure. monday AI Workspace closes that gap by keeping the template, the data, and the people who act on it in one connected workspace. Instead of copying numbers between systems, you track KPIs where the work already happens.
The table below contrasts a static spreadsheet with monday AI Workspace across the parts of KPI tracking that usually break down.
| Capability | Static spreadsheet tracking | monday AI Workspace |
|---|---|---|
| Data collection | Manual copy and paste from each system | Automated through 200+ integrations that pull from CRM, marketing, and finance tools |
| Updates | Periodic, whenever someone remembers | Real-time, as source data changes |
| Alerts | None; issues surface at review time | Threshold automations notify owners the moment a metric slips |
| Analysis | Manual charts and formulas | AI-generated summaries and anomaly detection show what changed and why |
| Collaboration | Version conflicts and emailed copies | A single source of truth everyone can see |
| Scalability | Slows down as metrics and teams grow | Scales across teams and portfolios without added admin work |
Dashboards for a single source of truth
Dashboards are the intelligence and reporting layer that turns work data into live, visual insight. You get no-code dashboard creation, numeric goal tracking, progress bar views, and portfolio or executive summary reports, plus scheduled reporting that lands in the right inboxes. AI features add proactive analysis, risk alerts, and AI-generated summaries, so leaders move from hindsight to foresight.
Automations that watch your thresholds
Automations replace repetitive manual actions with no-code recipes. For KPI tracking, that means conditional alerts when a metric crosses a threshold, automatic status changes as results shift, and scheduled report delivery to decision-makers. You set the rule once, and the workspace runs it.
Integrations that keep numbers current
With 200+ integrations, you can pull KPI source data from the CRM, marketing, and finance tools your teams already use into one connected view. Two-way sync means the numbers update automatically, so your template reflects reality instead of last week’s export.
AI that turns data into decisions
The platform’s AI capabilities help people act on KPI data faster, without handing judgment over to a machine. Three of them apply directly to performance tracking:
- monday sidekick: a context-aware AI assistant that lets you ask plain-language questions of your KPI data instead of building manual reports. Sidekick can summarize what changed and draft the update for you
- monday agents: task-specific AI workers that run on triggers. A reporting or insights agent can surface anomalies and draft summaries around the clock, working alongside your team rather than replacing anyone. Agents keep people in control of the decision
- monday vibe: a no-code app builder. Describe the KPI or OKR-monitoring app you need, and Vibe builds it, natively connected to your data and permissions

Used across 225,000+ organizations that run work on the platform, these capabilities help teams read performance data faster and act sooner, reflecting a workplace where 73% of Millennials are already adopting AI at work, according to monday.com’s World of Work report.
Turning KPI data into faster decisions
The teams that get the most from a KPI template aren’t the ones tracking the most metrics. They’re the ones whose measurement is consistent, owned, and close enough to the work that a number can change a decision the same day. Structure, not volume, is what separates reporting that informs from reporting that just describes.
The next step is closing the gap between the number and the action. As real-time, AI-assisted tracking becomes the norm, a KPI template stops being a static document you revisit each quarter and becomes a live signal your team responds to as work happens. Build the structure first, then let automation keep it current.
Frequently asked questions
How often should KPI templates be updated?
Review KPI templates quarterly and update them when business objectives shift significantly. Most organizations find that annual template overhauls with quarterly metric adjustments provide the right balance between consistency and adaptability.
What is the ideal number of KPIs to include in a template?
The ideal KPI template contains five to seven key metrics to maintain focus without overwhelming teams. Too many indicators create analysis paralysis, while too few may miss critical performance dimensions that matter to your business.
How do you ensure KPI template adoption across teams?
Successful KPI template adoption requires involving team members early in the design process and connecting metrics directly to their daily work, and research shows employees who understand how success is measured are more than twice as likely to feel motivated to achieve it, according to monday.com's World of Work report. Regular review meetings and recognition for performance improvements also drive consistent usage across the organization.
What is the difference between KPI templates and OKR frameworks?
KPI templates focus on ongoing performance measurement using consistent metrics over extended periods, while OKRs set specific objectives with measurable key results for defined time periods. Many organizations successfully combine both approaches for comprehensive performance management.
How do you choose between leading and lagging KPI indicators?
Leading indicators predict future performance and enable proactive management, while lagging indicators measure completed results to confirm strategy effectiveness. Effective KPI templates include both types: leading indicators for early warning and lagging indicators for performance validation.
Can KPI templates work for small businesses?
KPI templates work well for small businesses because they provide structure without requiring extensive resources. Small organizations benefit from simplified templates focusing on three to five critical metrics that directly impact growth and sustainability.
What is the difference between a KPI and a metric?
The difference between a KPI and a metric is significance. Every KPI is a metric, but a KPI is the specific measure tied directly to a strategic goal, while a metric can be anything you track. KPIs earn a place in your template because acting on them changes outcomes.
What makes a good KPI?
A good KPI is specific, measurable, achievable, relevant, and time-bound, following the SMART framework. It also connects to a decision someone can act on, has a clear owner, and pairs a leading indicator for early warning with a lagging one to confirm results.
How does monday AI Workspace handle KPI tracking?
monday AI Workspace handles KPI tracking by pulling source data through 200+ integrations, refreshing numbers in real time, and flagging risks with dashboards and automations. AI features summarize trends and detect anomalies, while people stay in control of the decisions those insights inform.
 Get started